Go ahead and take a deep breath, we'll wait. Refreshing?
Well, consider this: even though the air is clear, you've just inhaled millions of solid particles and liquid droplets.
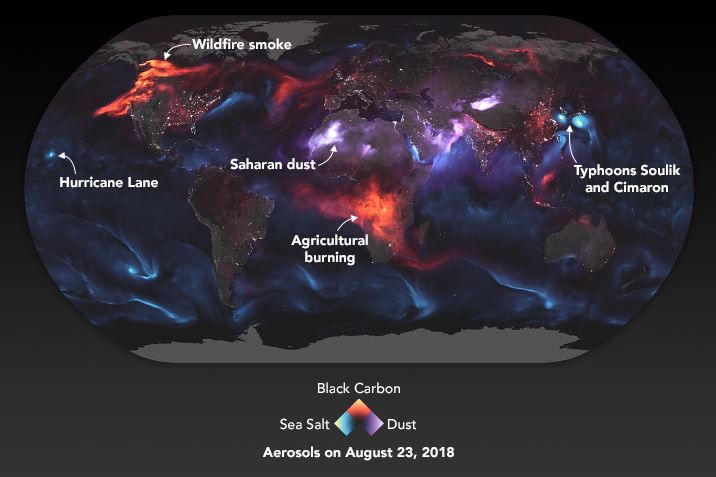
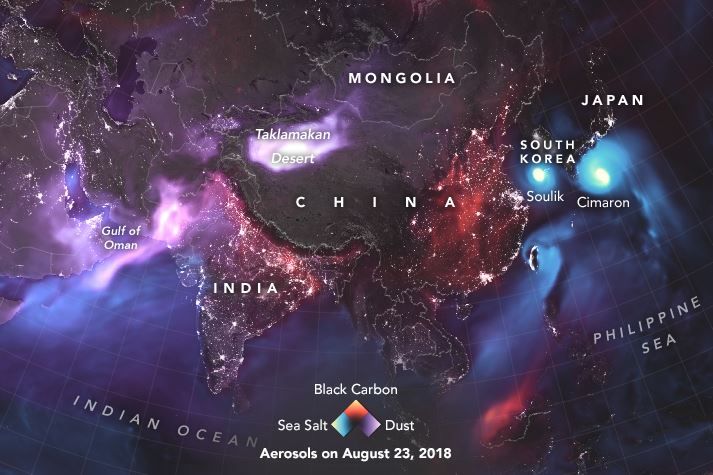
These NASA Earth Observatory maps use data from the Goddard Earth Observing System Foreward Processing (GEOS FP) to visualize the aerosols in the air above the planet:
The visualization above highlights GEOS FP model output for aerosols on August 23, 2018. On that day, huge plumes of smoke drifted over North America and Africa, three different tropical cyclones churned in the Pacific Ocean, and large clouds of dust blew over deserts in Africa and Asia. The storms are visible within giant swirls of sea salt aerosol (blue), which winds loft into the air as part of sea spray. Black carbon particles (red) are among the particles emitted by fires; vehicle and factory emissions are another common source. Particles the model classified as dust are shown in purple.


Commenting on Neatorama will earn you NeatoPoints!